Formatting Specific Chart Types
Pie charts, bar and column charts, and other specific chart types have special
formatting options.
For example, you can apply a shadow to individual pie wedges, move wedges away
from the center of the pie, use different symbols for data points along different lines in
line charts, and more.
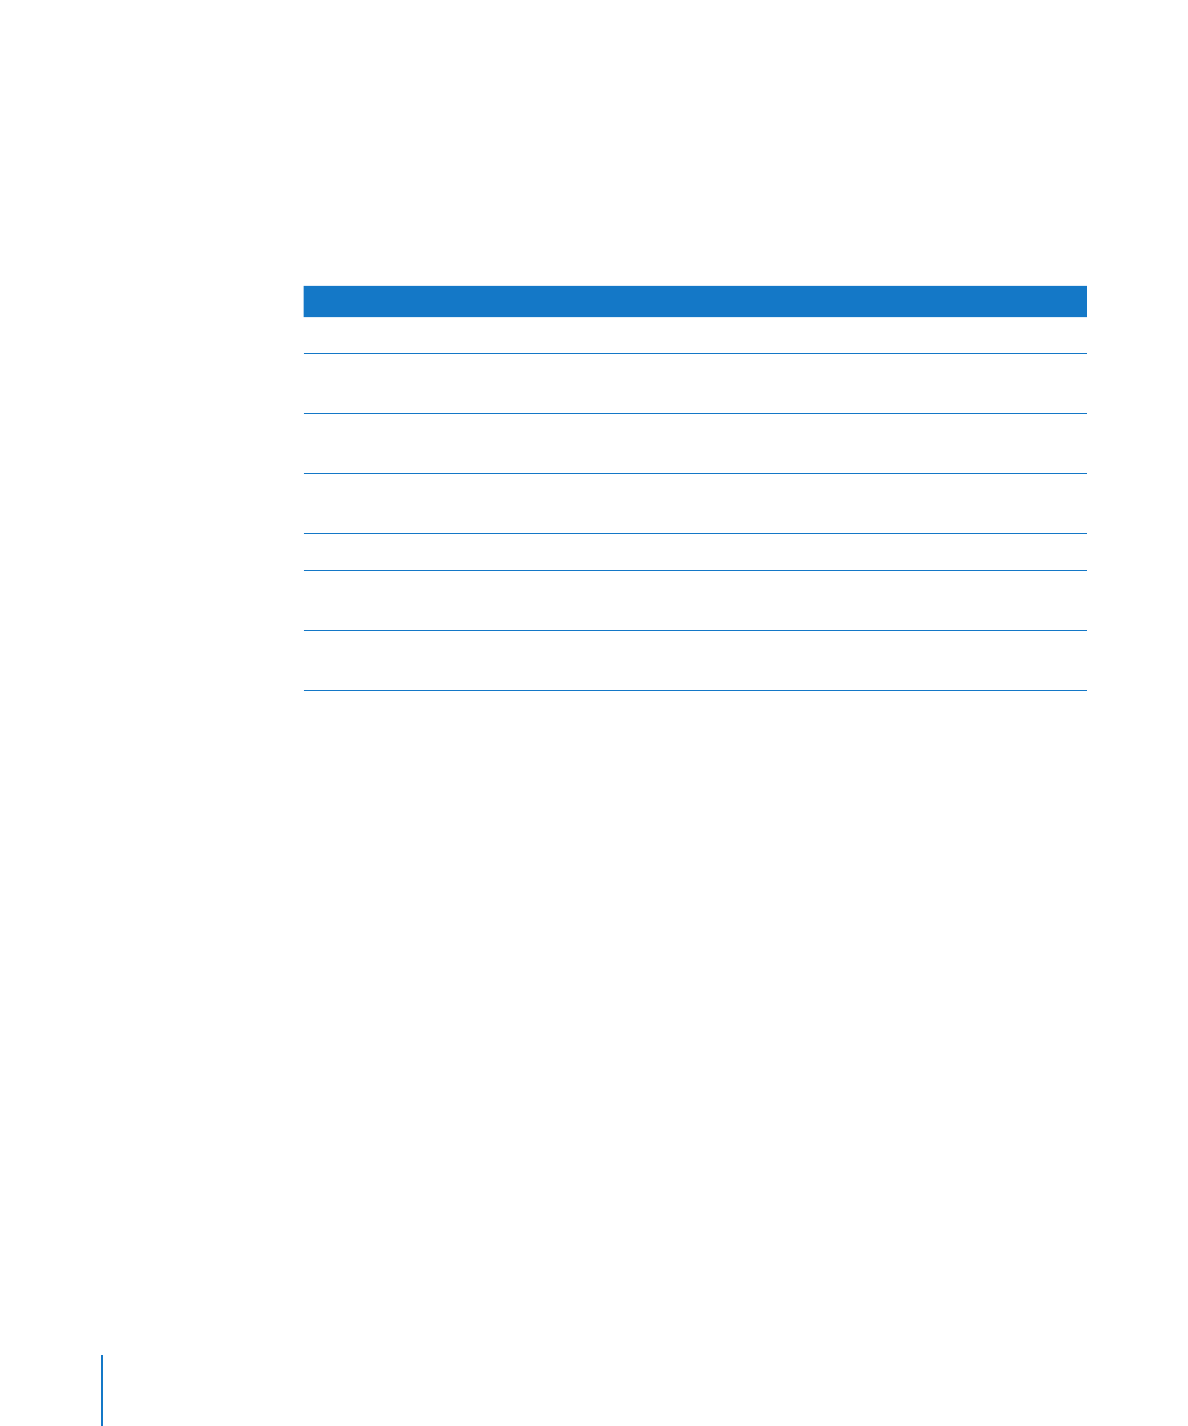
To learn how to
Go to
Format pie charts and individual wedges in them “Customizing the Look of Pie Charts” on page 154
Format the bars in bar and column charts
“Setting Shadows, Spacing, and Series Names on
Bar and Column Charts” on page 158
Format line chart elements
“Customizing Data Point Symbols and Lines in
Line Charts” on page 159
Format area charts
“Showing Data Point Symbols in Area Charts” on
page 160
Format scatter charts
“Using Scatter Charts” on page 160
Format 2-axis and mixed-type charts
“Customizing 2-Axis and Mixed Charts” on
page 161
Format 3D charts
“Adjusting Scene Settings for 3D Charts” on
page 162